Final inspection of Gotthard Base Tunnel
Client
Swiss Federal Railways
Task definition
Documentation of the actual condition
Clearance inspectionnd clearance mapping
Crack detection and crack mapping
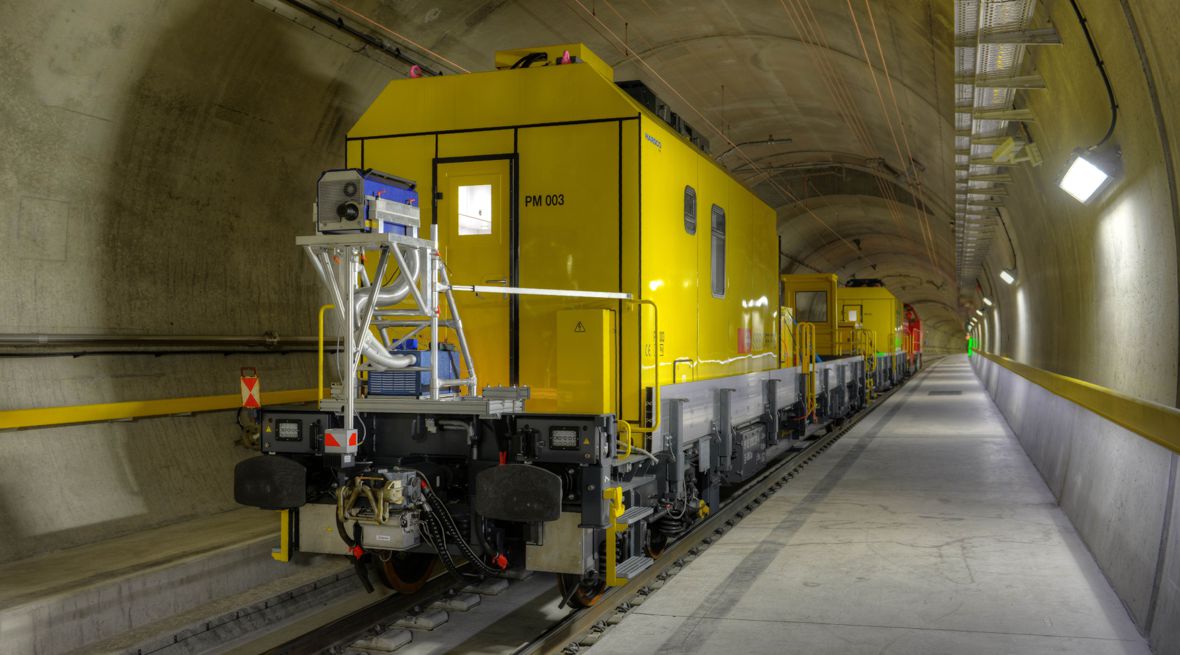
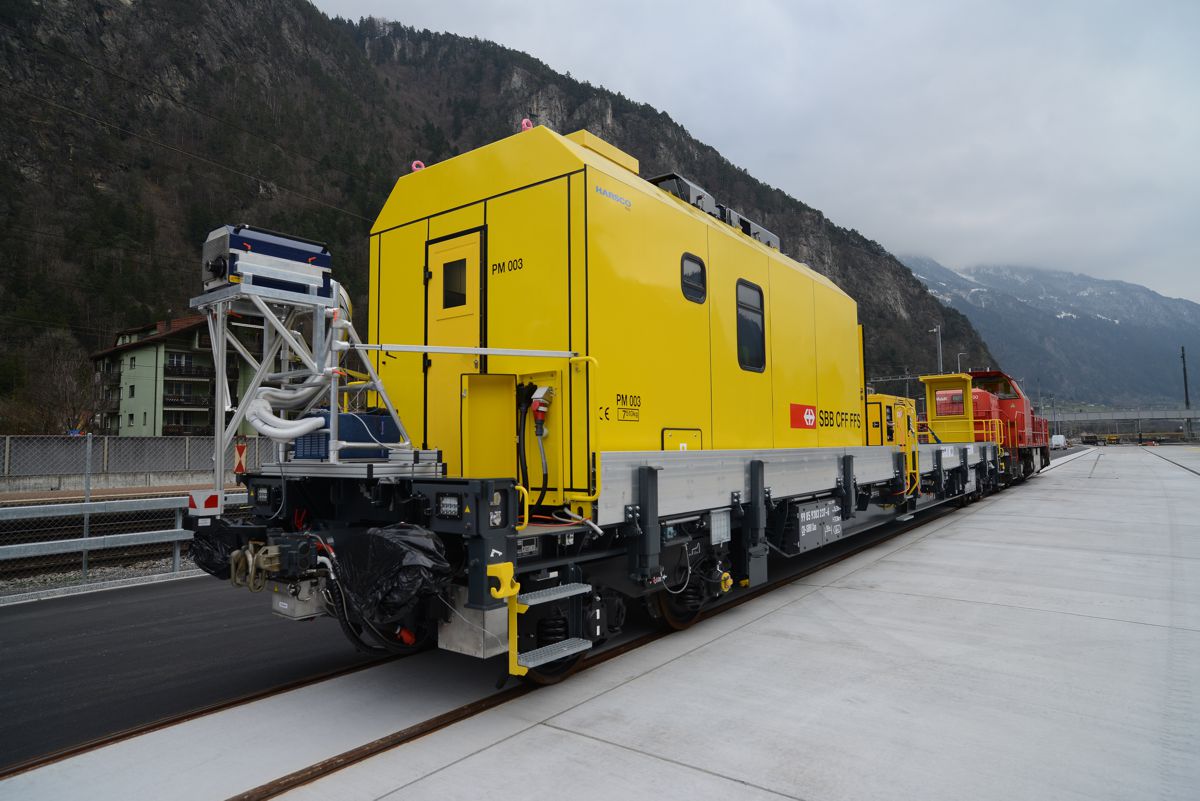
Measurement
- Recording with the SPACETEC TS3
- Total length of 120 km
The longest railway tunnel in the world
The Gotthard Base Tunnel (GBT) is truly unique. It directly connects the canton of Uri on the northern side of the Alpine divide with the canton of Ticino on the southern side. Avoiding the bends, spiral tunnels and slopes of the Gotthard mountain line, the tunnel only had to overcome a difference in elevation of around 240 m. It therefore reduces travel time by up to an hour. Due to the more gentle gradient, freight trains can transport considerably heavier loads while travelling at much higher speeds.
- 17-year construction period
- Opened on 1 June 2016
- A total of 120 km of tunnel tubes
- Overburden of 2450 m
- Up to 38°C in the tunnel centre
Superior measuring equipment
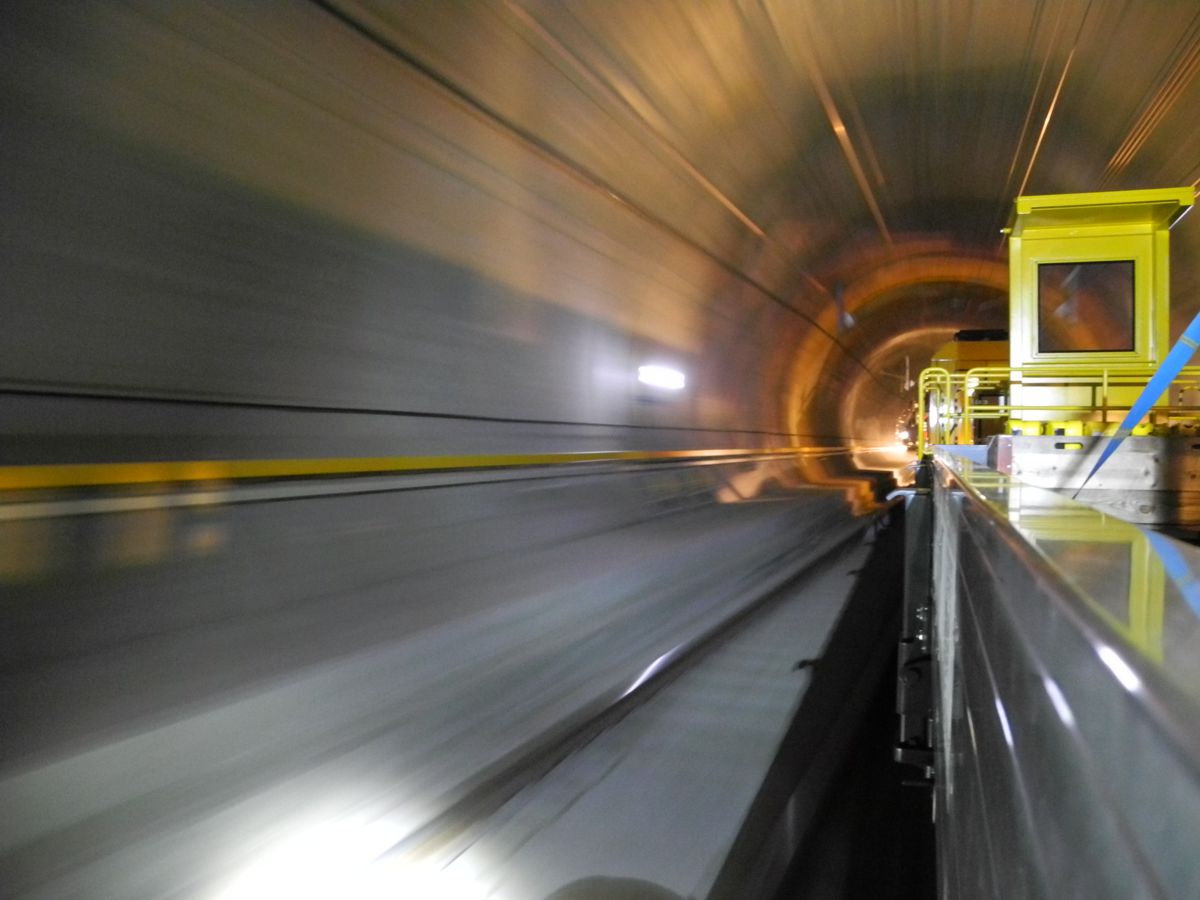
To comprehensively survey an object with the gigantic proportions of the GBT in detail, high-performance recording technology is key. The scanning process had to be completed in just a few short days, as the work on completing the tunnel could not be affected.
- Scan performed in just six shifts
- Image capture, thermal imaging and 3D recording in a single passage through the tunnel
- 360° camera angle
- 10,000 pixel resolution in 360°: 2.5 mm point spacing
Extensive documentation
With many billions of individual points, the scan comprehensively documents the composition of the entire tunnel structure’s surface. Such a high density of points enables the identification of even the smallest detail.
Software tools designed specifically for managing such huge quantities of data ensure that every location in the tunnel is easily retrievable and available for analysis. The tools offer a good overview of the present state of the entire tunnel structure as well as a detailed analysis, for example of hairline cracks.
Detailed information from three synchronous data channels
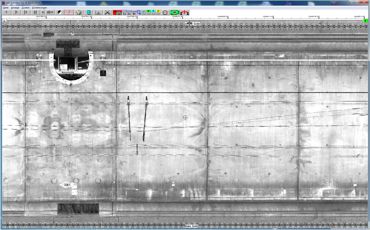
The intensity image of the laser scanner documents the actual condition of the entire tunnel’s surface. The analysis software enables simple and swift navigation within the dataset and provides user-friendly zooming tools for analysing fine details.
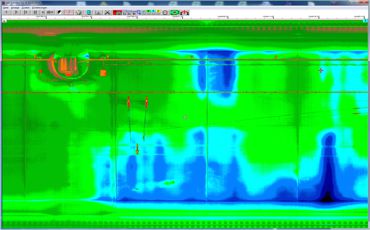
The thermal image reveals valuable additional information which cannot be seen in the intensity image or in moving through the tunnel, making it easy to identify water ingresses and moisture in the concrete.
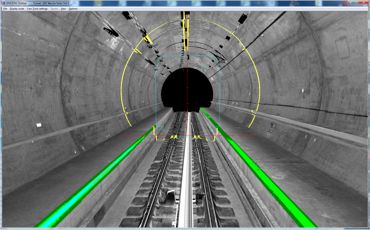
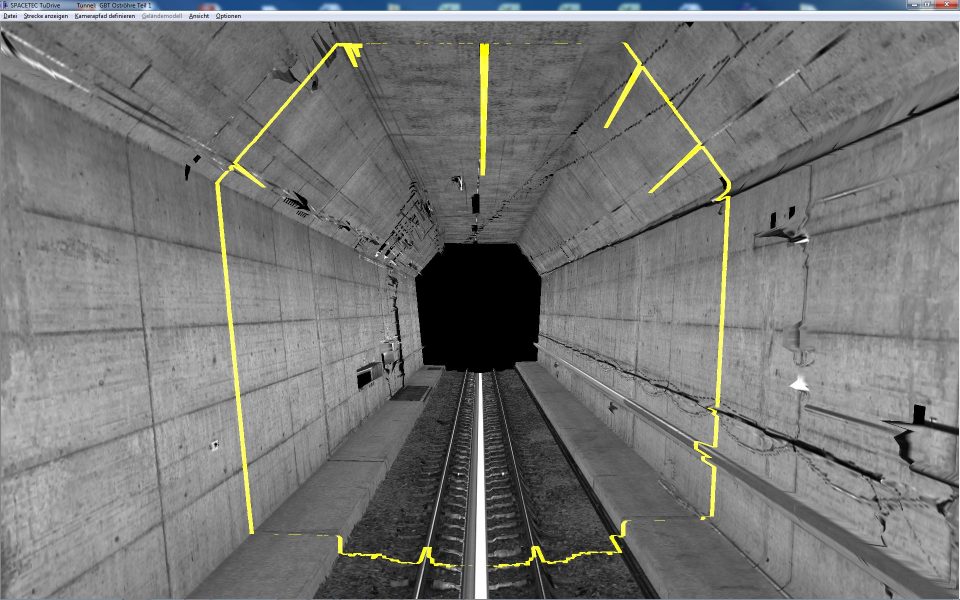
The 3D data is used to create a realistic representation of the tunnel on a computer screen. Any damage to the surface, such as spalling, is easily identified. Software functions check a cross section of the tunnel for deviations from a target profile.
Detailed information thanks to a high point density
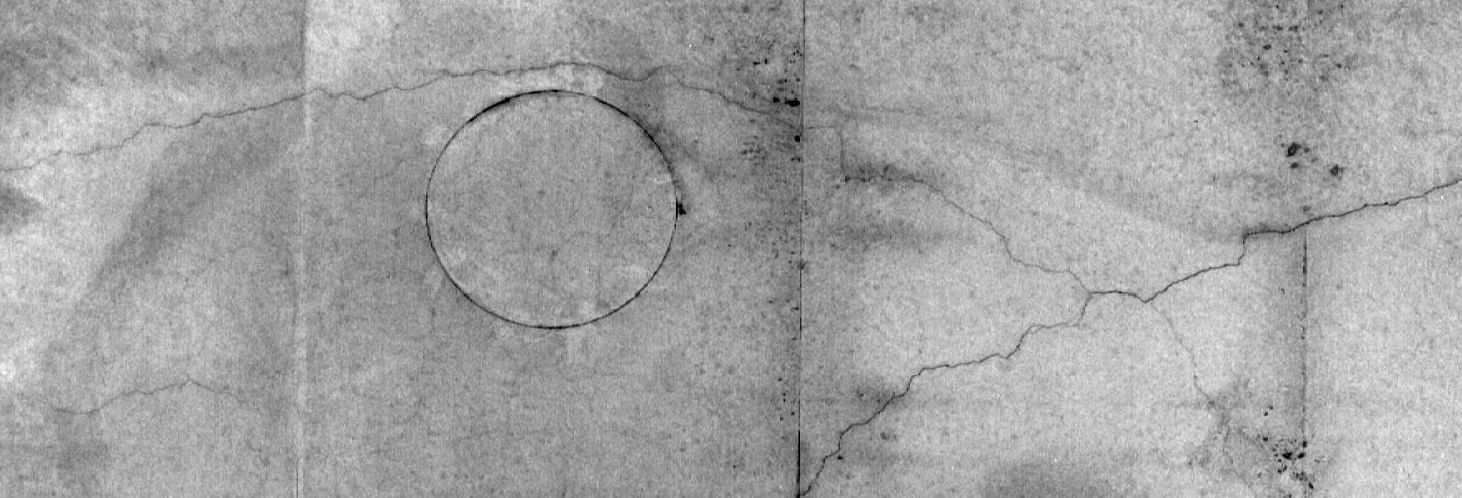
In concrete tunnel walls cast on site, shrinkage cracks which occur during the drying process are unavoidable. A crack pattern considered normal for a given construction method is therefore not considered a structural defect. Only cracks which are conspicuous on account of their size or frequency require repair.
The scan documents the current crack pattern in great detail. The inspection is repeated at regular intervals of a few years to ascertain whether there have been any locally relevant changes. Such changes could indicate particular stress on the structure at that location or the early stages of a structural defect.
Mapping for quantitative data collection and analysis
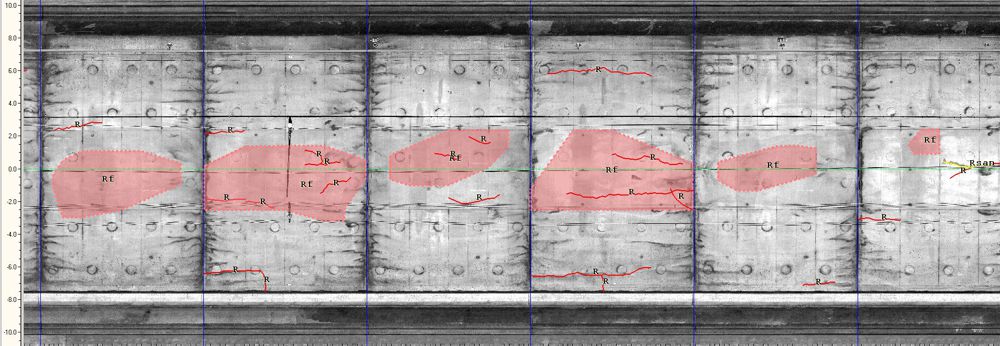
The Tunnel Inspector software package offers comprehensive mapping functions to capture the features visible in the scan. The intensity image from the scan is displayed in the background of the drawing screen to ensure that the map accurately represents the position, shape and size of the features.
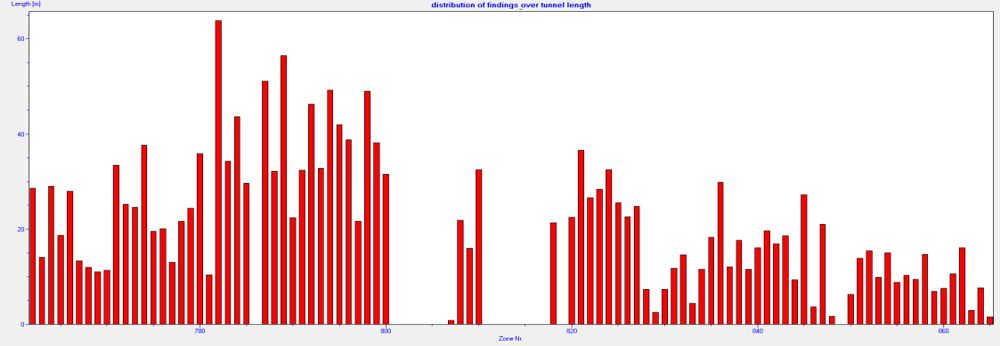
From this, statistical tools integrated in Tunnel Inspector are able to collect data on the type, quantity and distribution of the features. Graphic displays provide an overview of the actual condition. This data can be compared with subsequent measurements to determine changes over time.