TuView – data analysis tool
TuView is a program for visualising and analysing data obtained by the TS2 and TS3 tunnel scanners. It is specifically tailored to the needs of test engineers and its functionality has been — and still is — developed in close cooperation with our clients. Since many of the functions available today were inspired by suggestions from our users, the program is easy and intuitive to use, allowing engineers to focus completely on the task at hand.
Changes at the client’s request
SPACETEC continues to develop and support TuView. In response to the needs of our clients, changes and adjustments may be made at short notice.
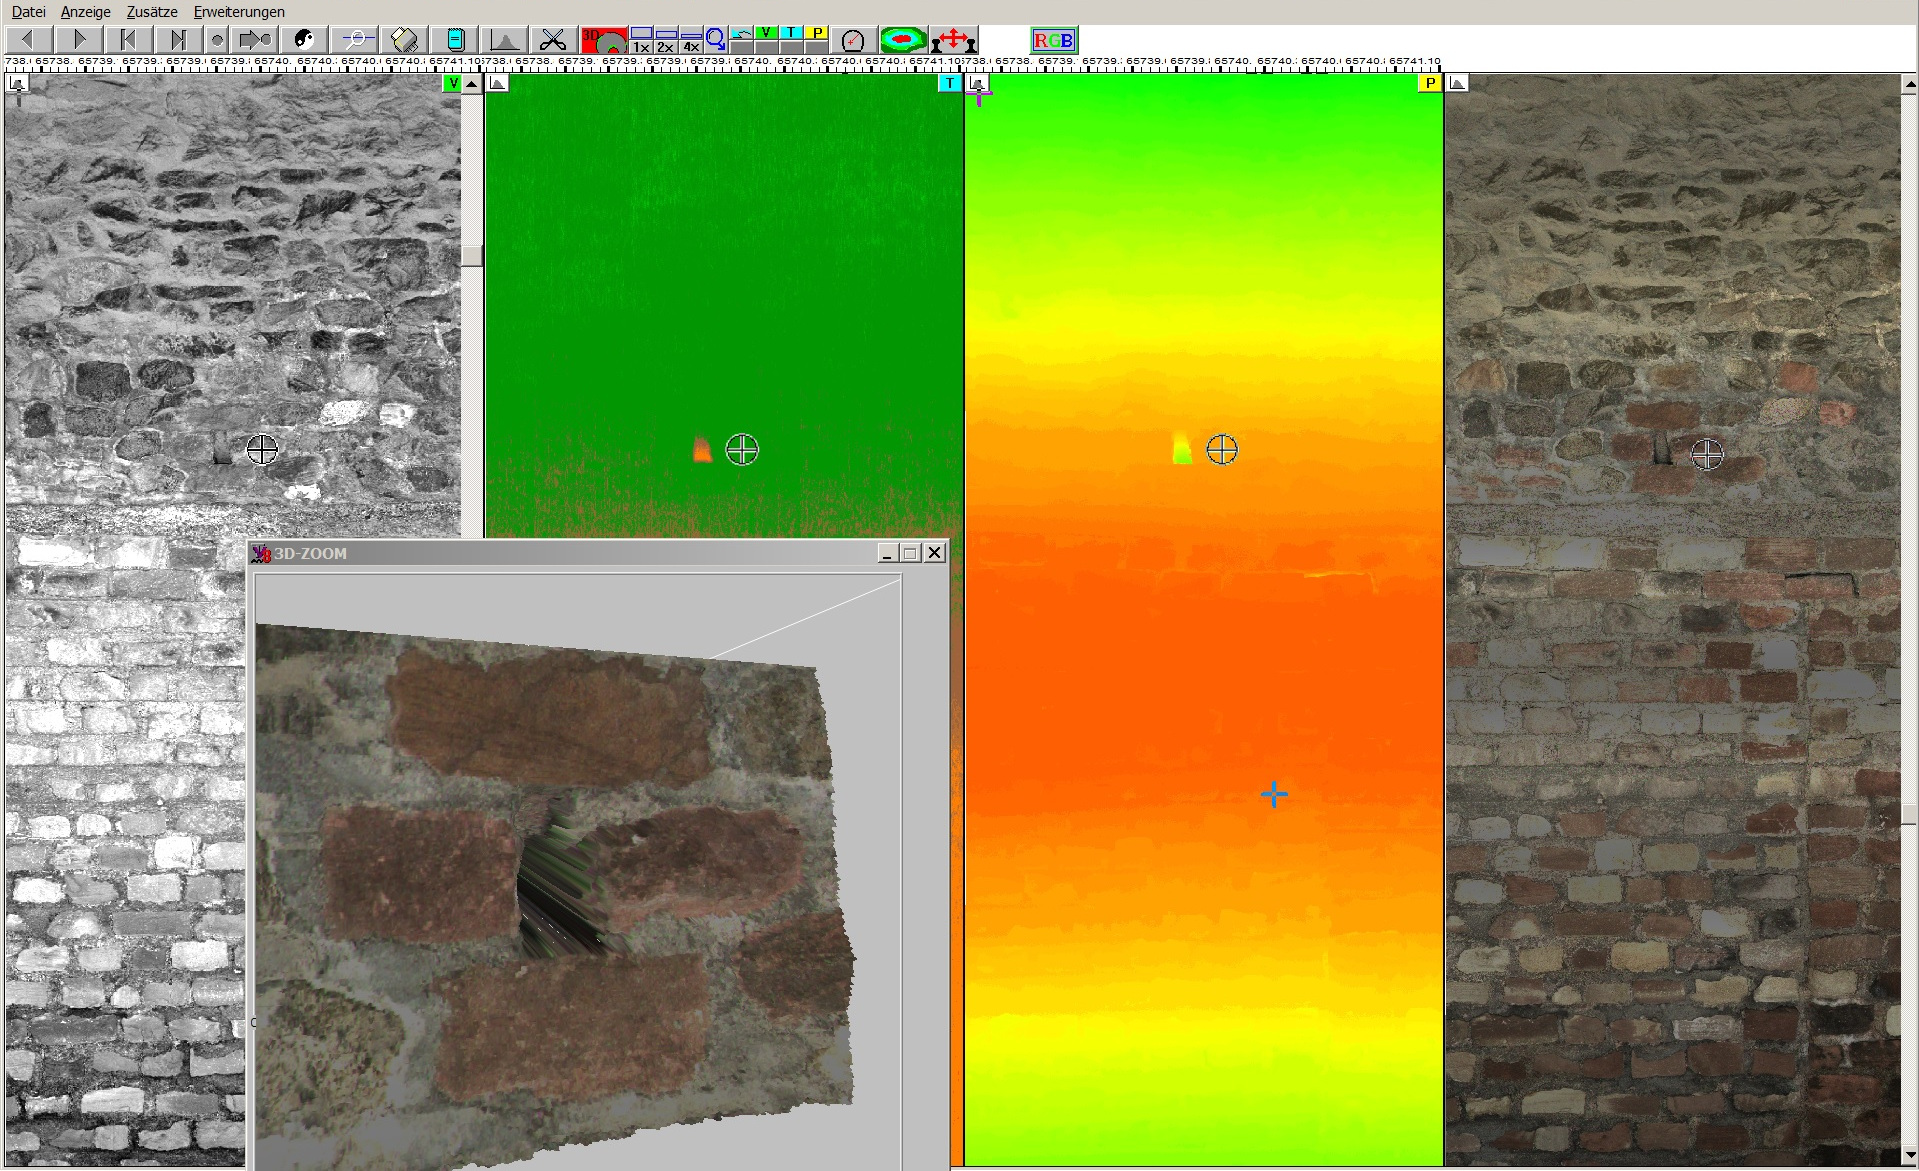
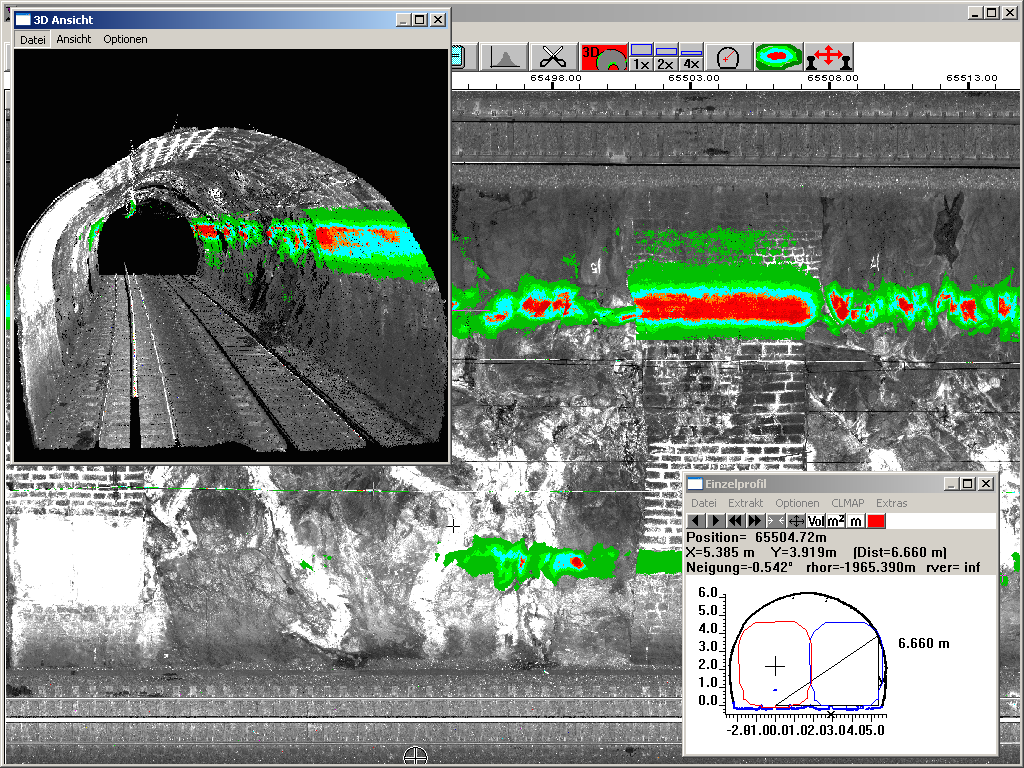
The concept behind TuView is to enable virtual tunnel inspection using the recorded data. The program includes function keys that allow the user to control the direction of travel, search for a specific point, zoom in or display an overview. It also offers a positioning scale and the option to adjust brightness and contrast for improved analysis of individual areas.
Support for all data channels
TuView is designed to support all three SPACETEC TS3 channels and takes advantage of the pixel-by-pixel synchronicity of the recordings. Anomalies in one channel can be identified with the support of the others.
Since 2018, RGB data from the SPACETEC TS4 have also been included in the display.
Function overview
Visualisation
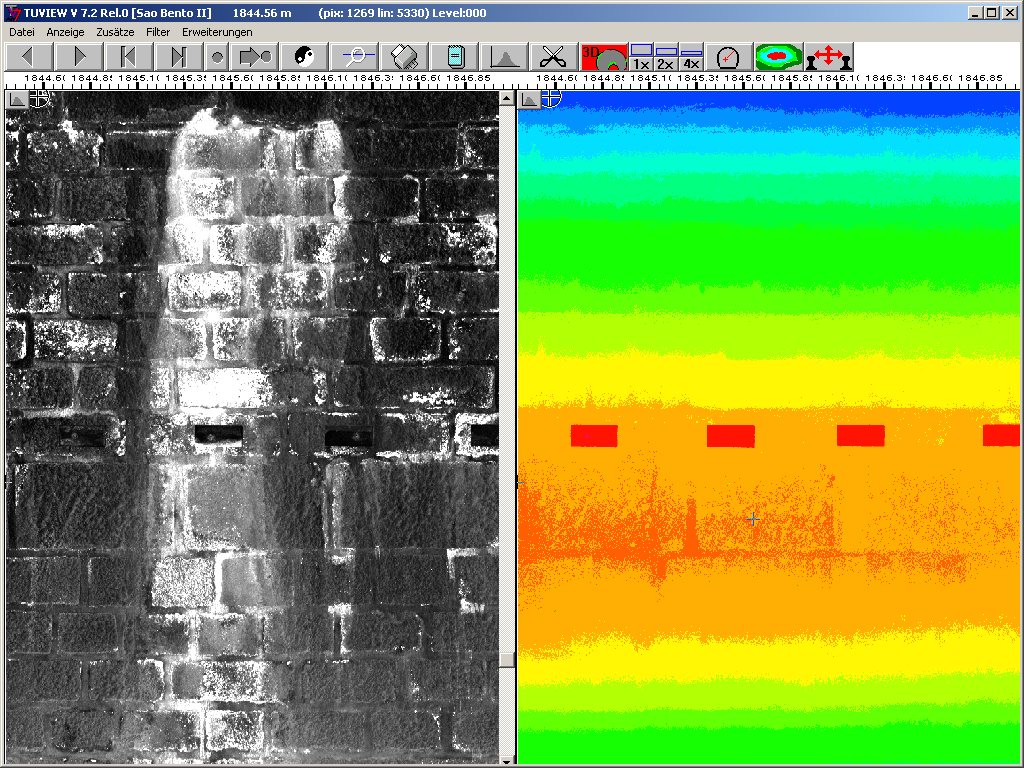
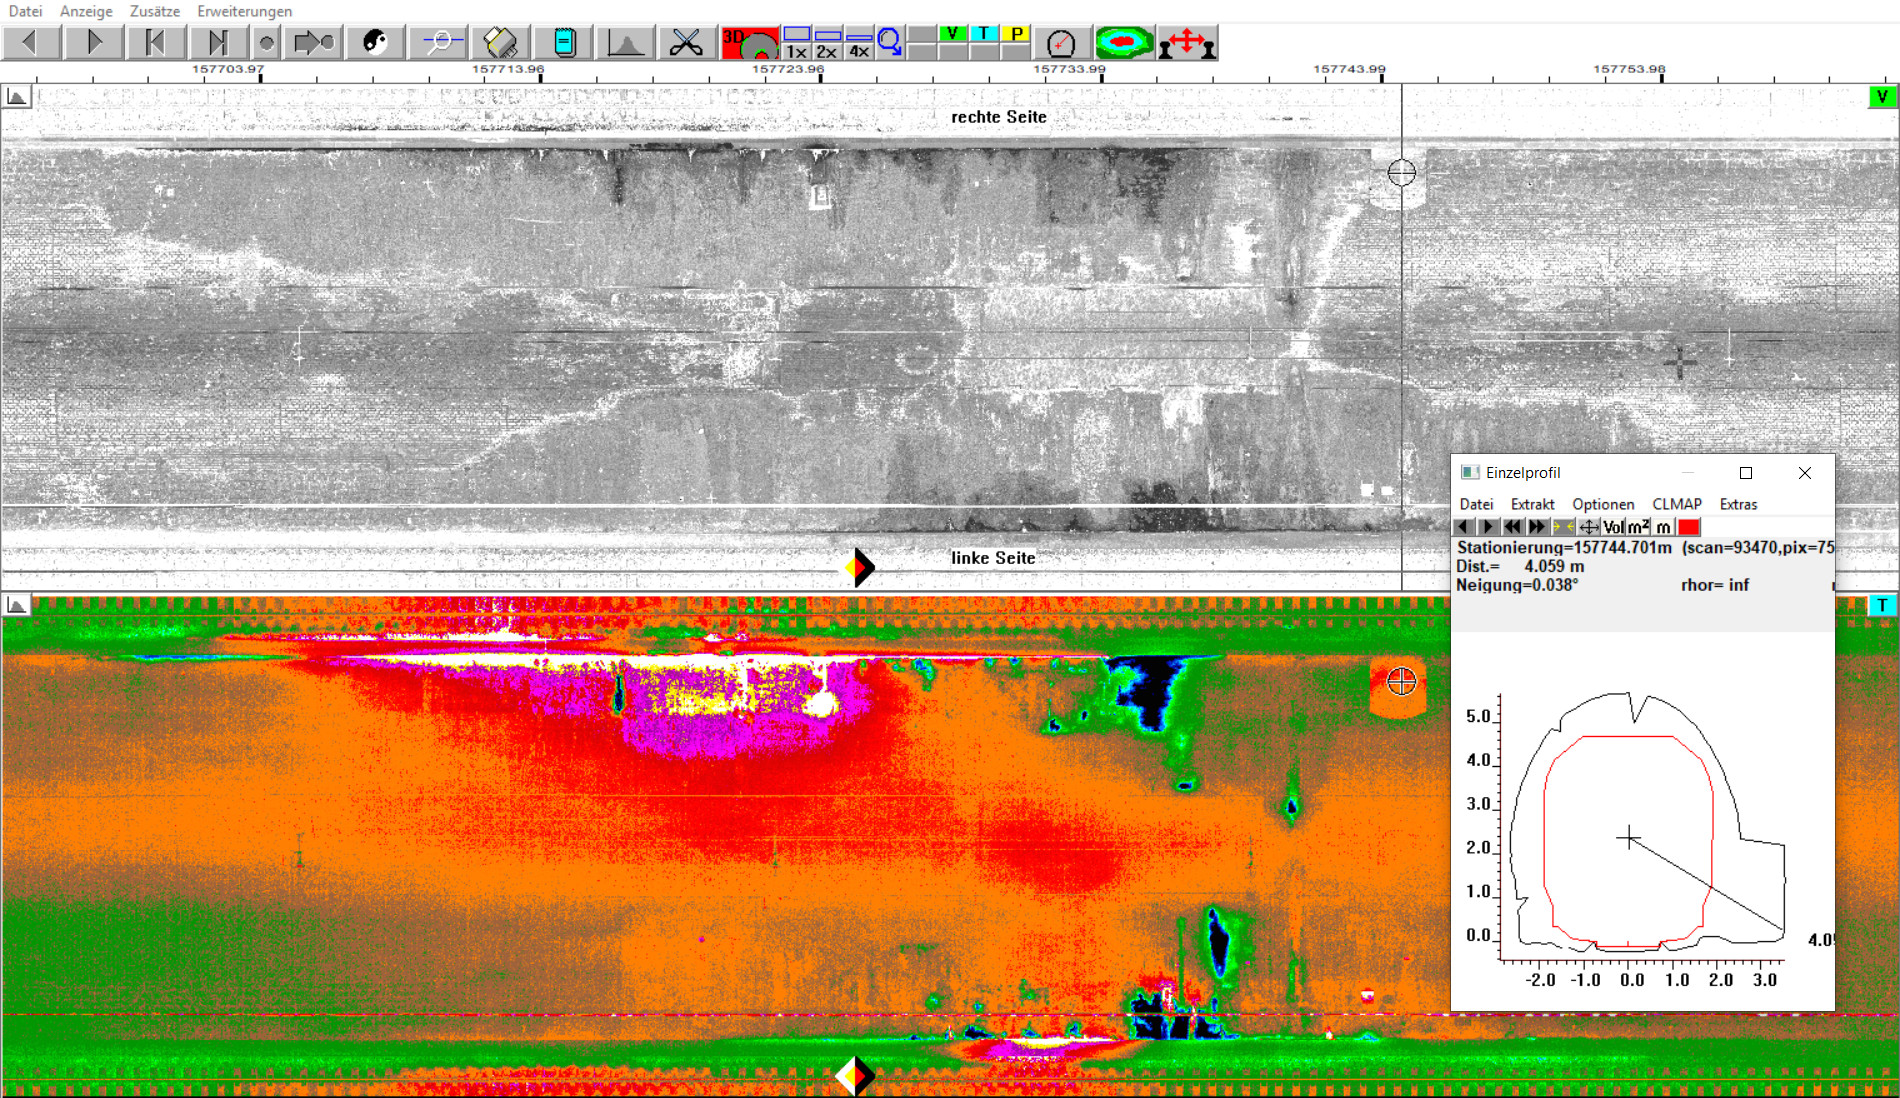
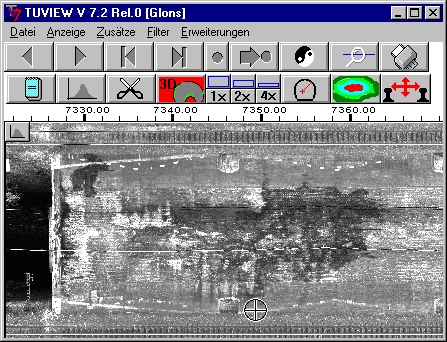
- True-to-scale 360° view of the tunnel surface as a development
- Synchronous display of all channels (visual, thermal and 3D) + RGB
- High-resolution detailed display (zoom)
- Adjustable contrast and brightness display settings
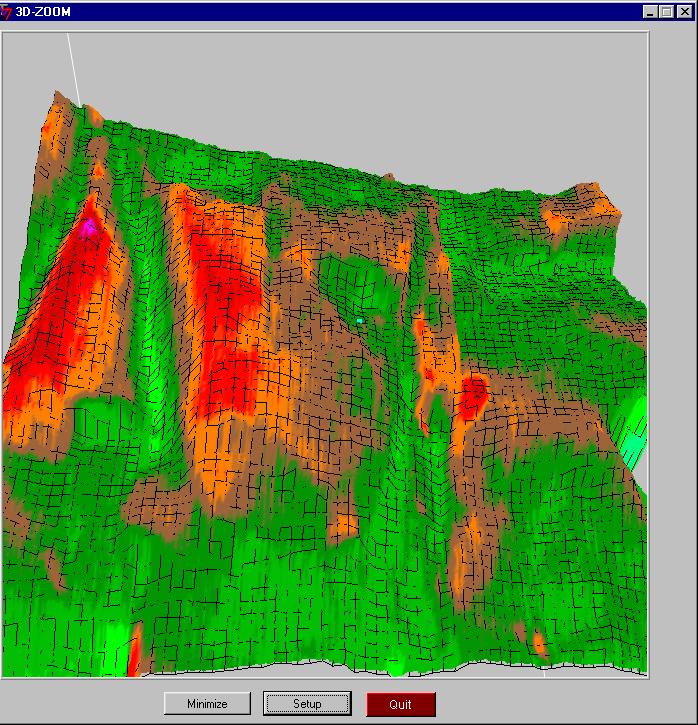
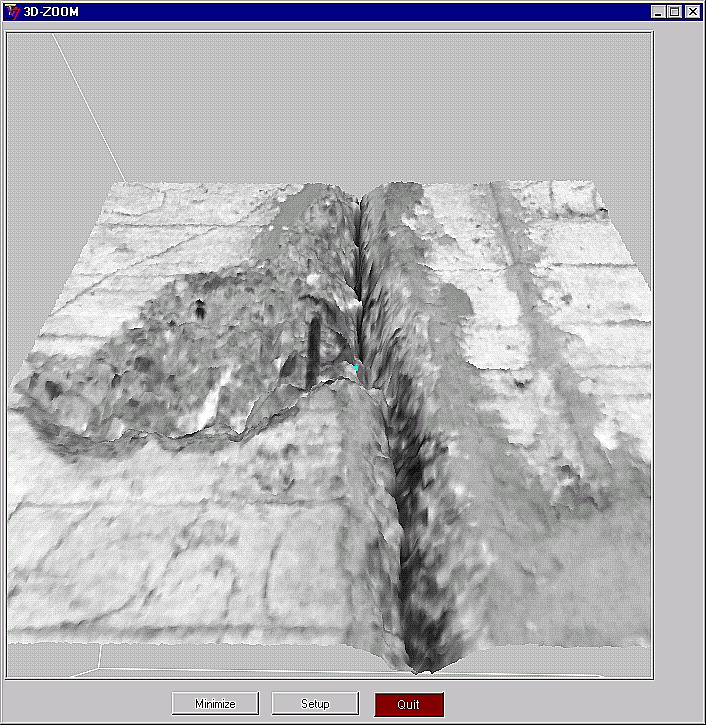
- 3D visualisation and 3D zoom for details
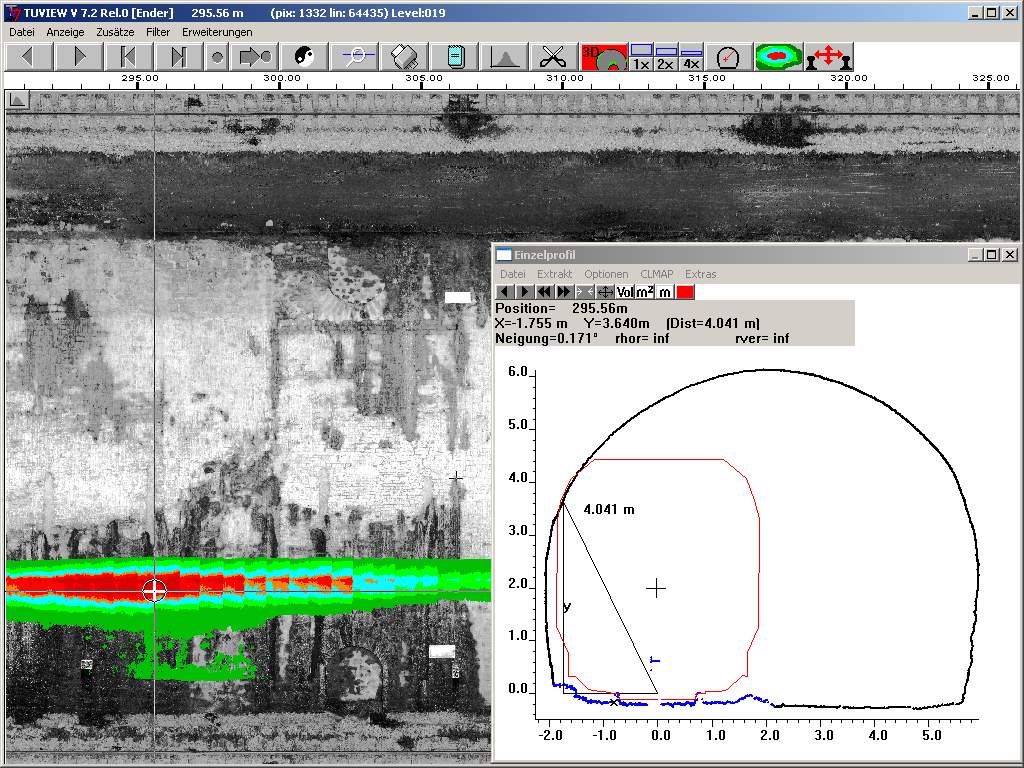
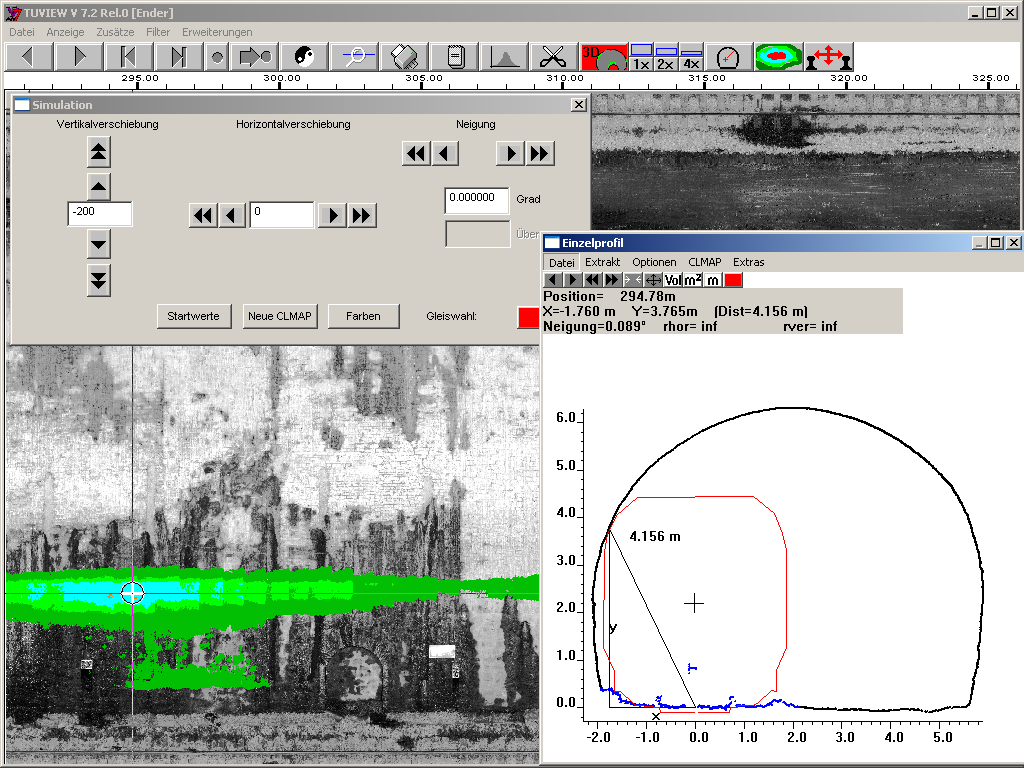
Analyses and clearance assessments
- Record findings with markers and notes
- Compare images from different years
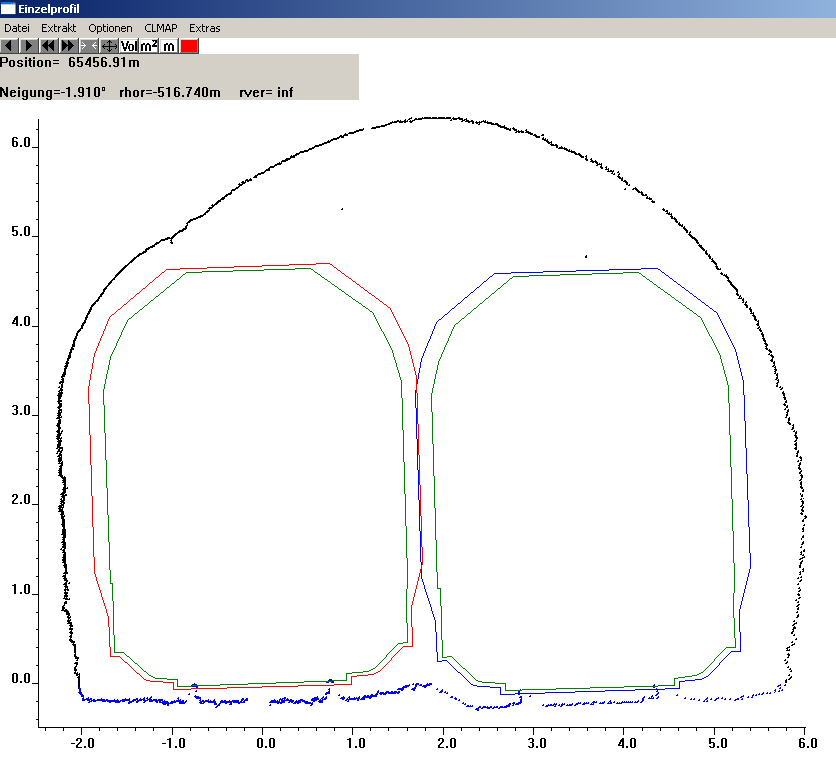
- Generate a clearance profile map to determine the position of constrictions relative to any specified clearance or target profile
- Generate a clearance profile map with freely selectable colours and critical distances
- Set theoretical profiles (clearance profiles or target profiles) as needed
- Use dynamic clearance profiles
- Simulate changes in track position
- Generate minimum or maximum profiles
- Calculate volumes (e.g. excavation volumes, filling volumes)
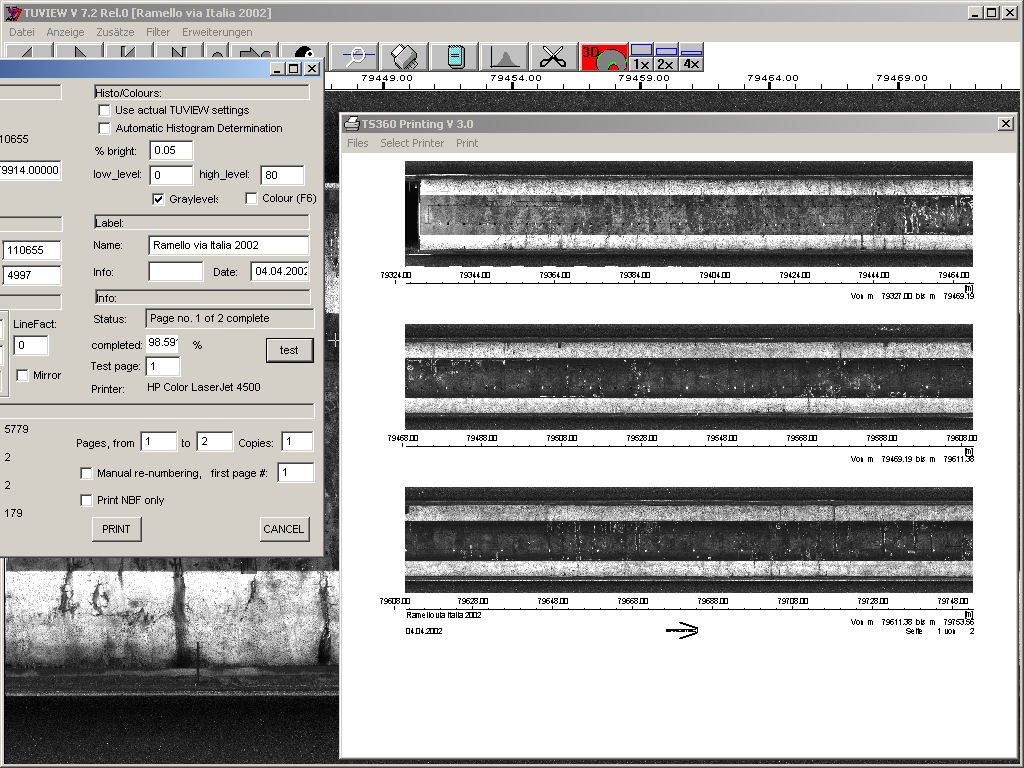
Exporting and printing
- Export images as TIFF files or bitmaps
- Select profiles and print or plot
- Select profiles and export to DXF for CAD programs
- Select profiles and read out/export the measured coordinates as XY values
- Produce books of images using the print function (serial printing)
- Use “print screen” function