Tunnel-Inspector – your digital tunnel inspection assistant
Tunnel Inspector supports you throughout the entire tunnel inspection process.
During the preparation phase
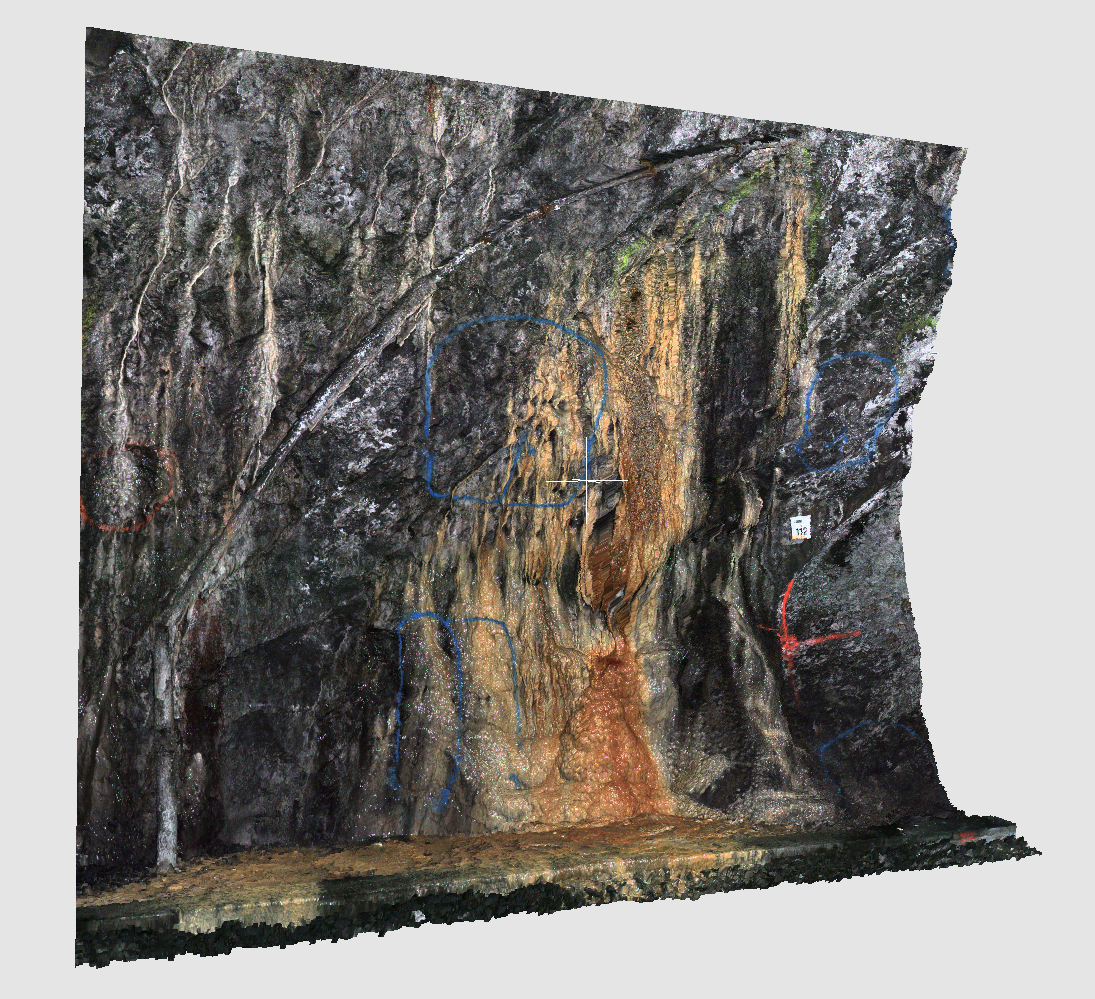
Careful preparation helps cut down on the time and effort involved in the actual inspection on site. Optimal preparation involves performing a scanner recording in advance, which Tunnel Inspector uses to mark all visible phenomena.
This makes it easy to locate these phenomena during the on-site inspection. Entries from previous inspections are imported and serve as the basis for the upcoming inspection, saving you time, since previous findings that have not changed do not need to be redrawn.
At the on-site inspection
Tunnel Inspector also helps engineers perform tunnel inspections on site.
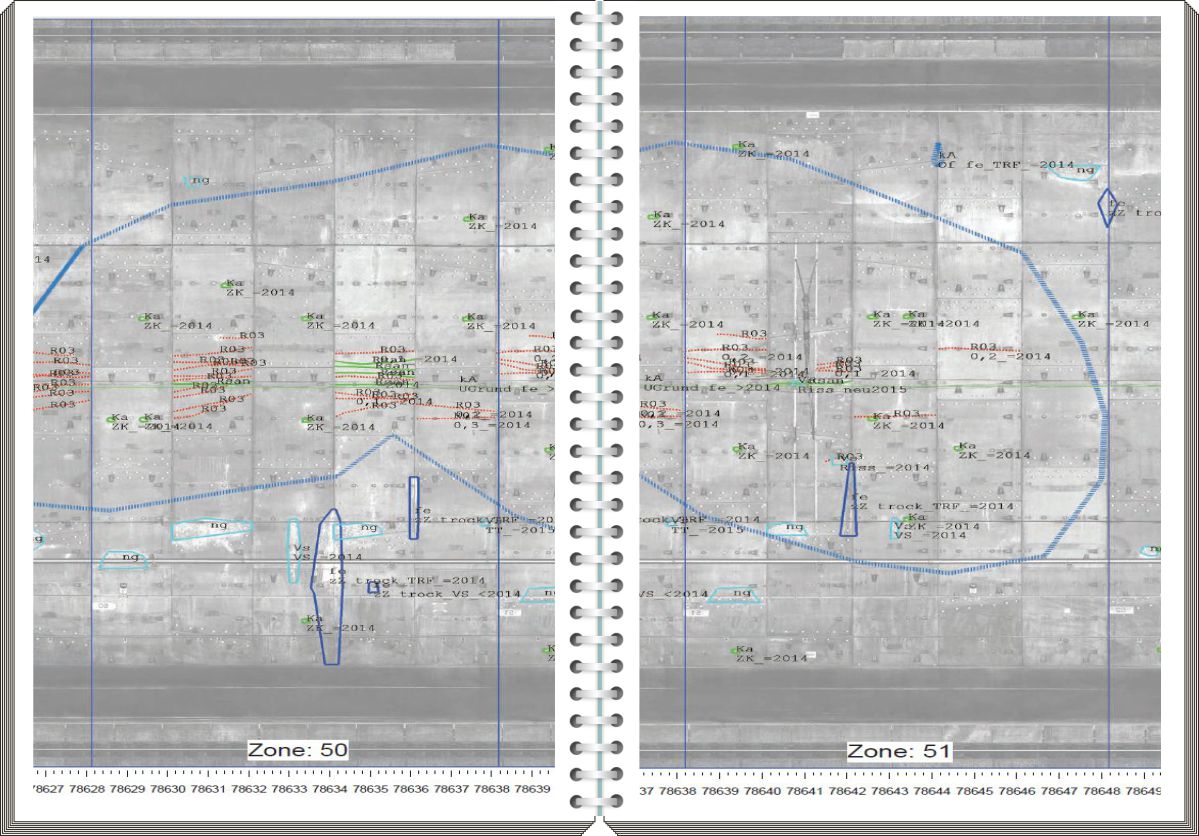
Scan data and damage maps can be printed in zones and brought along as a book so that findings can be entered by hand.
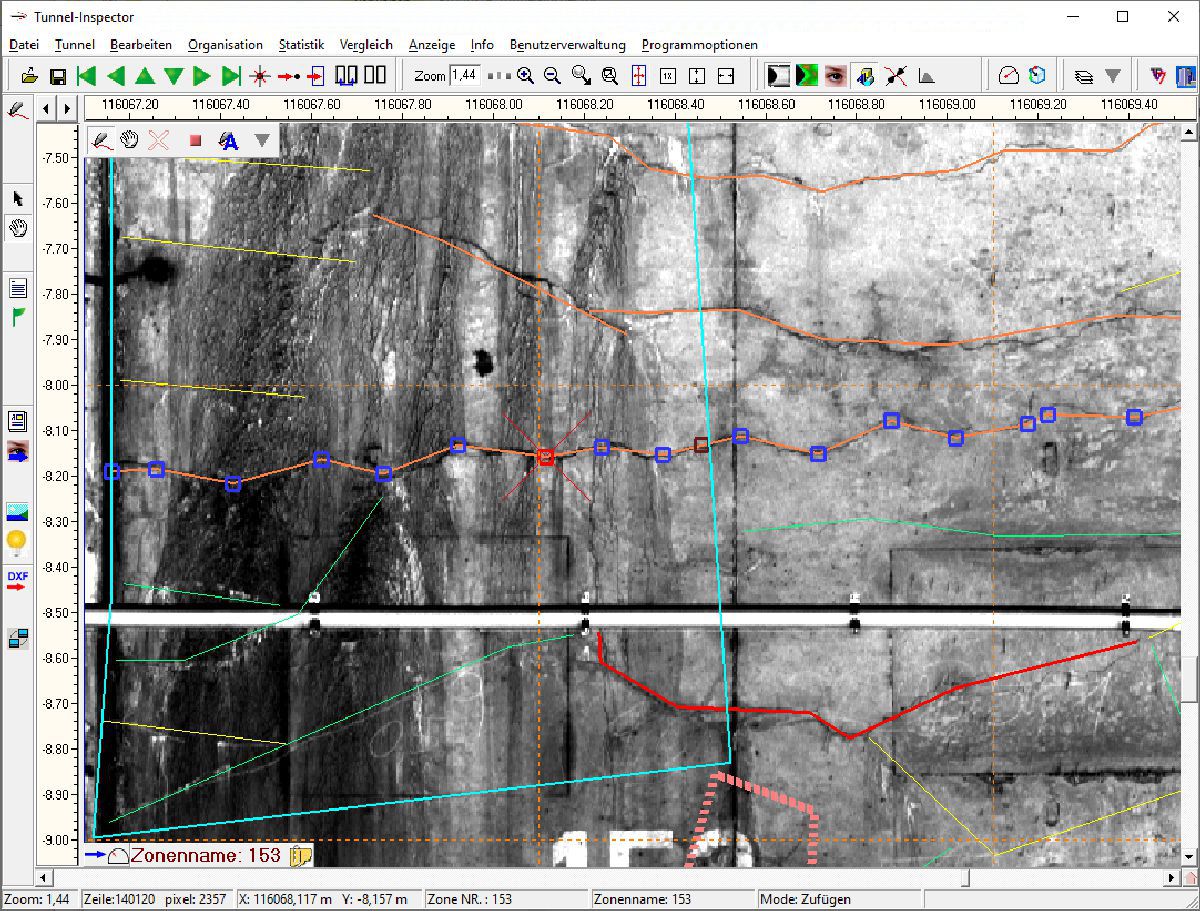
A mobile computer makes all information available on site, including data from previous structural inspections as well as the scanner recordings. Simple tools help the user to optimally display the scanner recording and navigate through the dataset. Findings can be easily recorded by selecting from a menu and drawing them onto the scanner recording. All functions such as zooming in on the images, moving through the dataset and drawing in findings are designed for ease of use on the mobile computers on site.
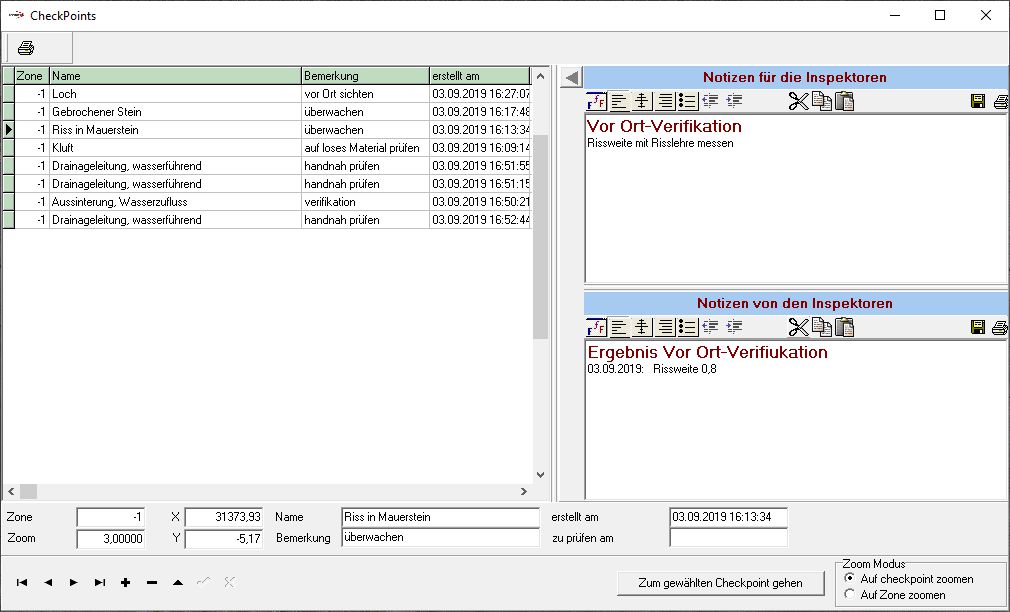
With the help of a checklist, working through verifications on site, recording findings and completing documentation is a breeze.
During subsequent analysis in the office
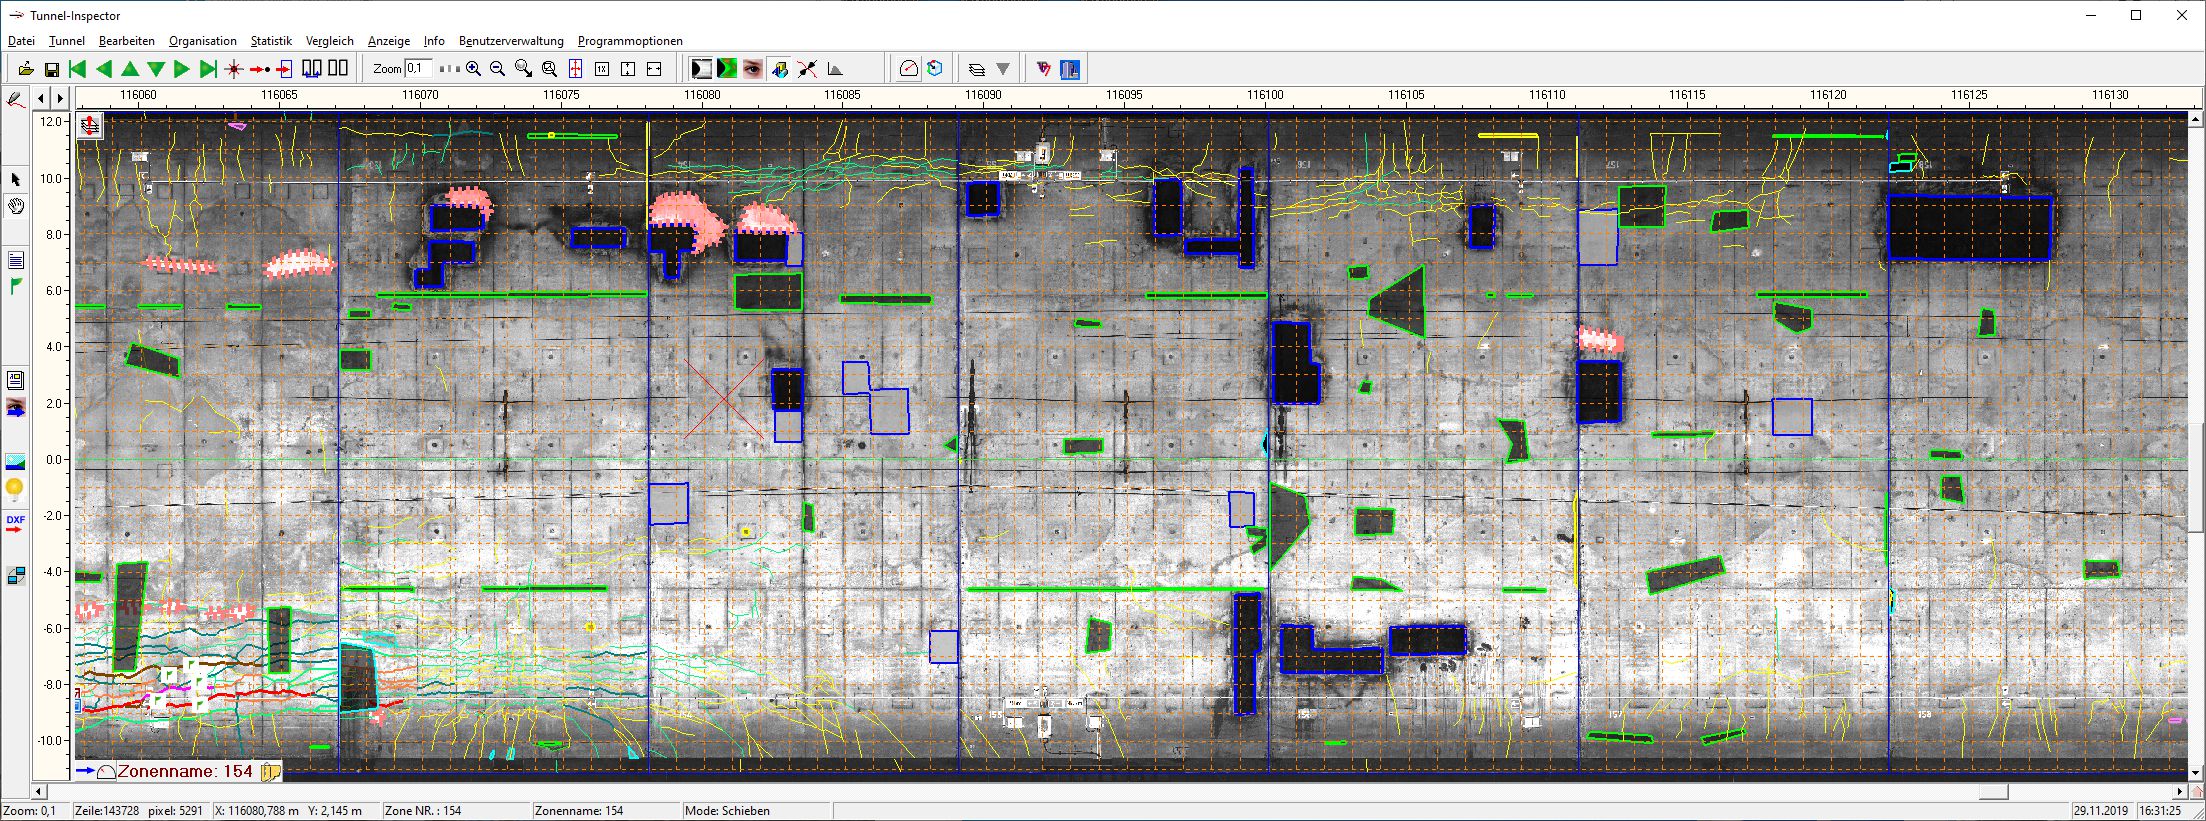
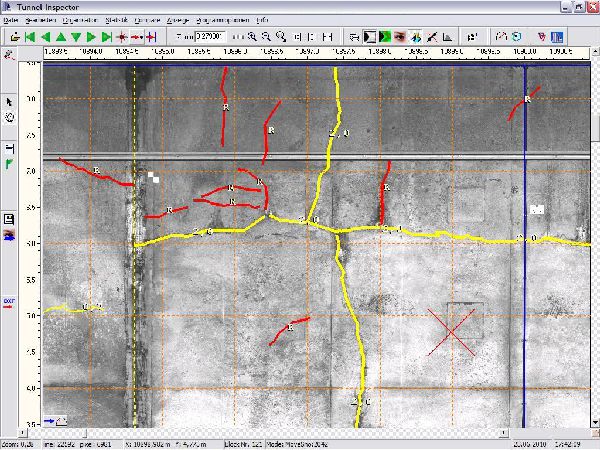
The inclusion of the scanner data in the background facilitates working with the inspection data, since findings that have been mapped over the image background are far easier to assess than a drawing alone.
Tunnel Inspector provides access to all recording channels and preserves the relationships between the channels in order to offer a variety of display options.
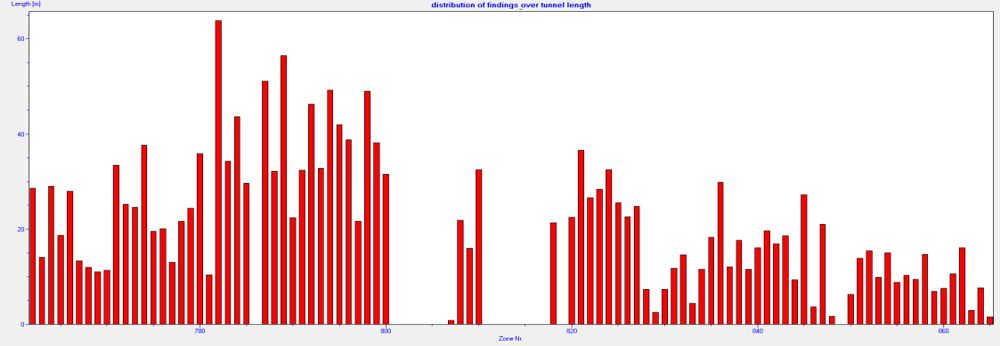
Simultaneously recording the type, number and size of the findings and assigning a condition rating allow for an objective assessment of the condition of the structure and serves as the basis for planning necessary measures. Integrated statistical tools quantify and compile the collected information in a structured form.
In assessing damage development
Assigning condition ratings to a structure is an important tool for planning necessary maintenance.
But assessing how the damage has developed over time is even more crucial than recording and evaluating the current state of damage.
For example, a certain amount of cracking is normal in tunnels with a cast concrete lining, with cracks typically forming soon after the lining is installed. If the crack pattern subsequently remains stable, there is no need to fear that the structural stability has been compromised.
However, if significant changes to the cracking pattern appear over time, this may be a sign of a serious problem.
In assessing damage development with Tunnel Inspector
Tunnel Inspector offers a variety of functions that provide information about damage development.
- The image comparison reveals changes to the surface of the concrete lining.
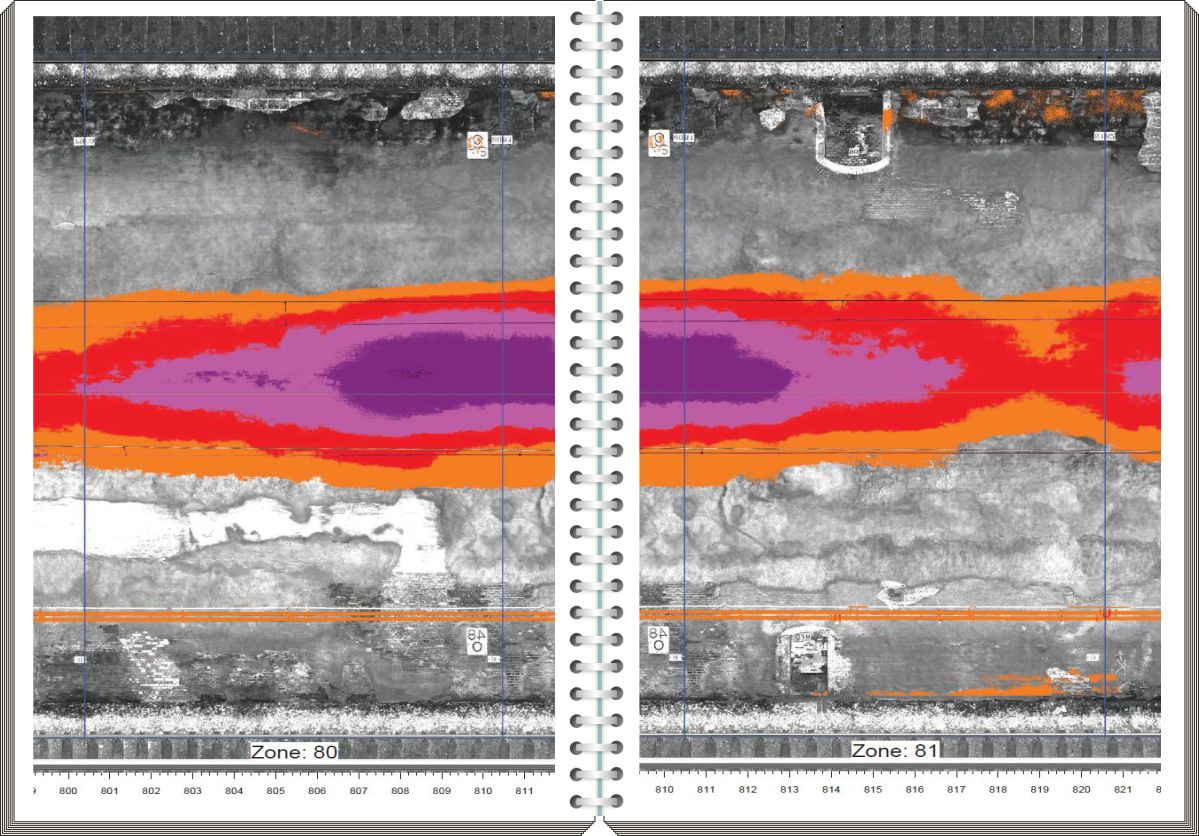
- The profile comparison displays changes in the form of the tunnel surface, making it easy to identify spalling and deformation.
- A visual comparison function highlights the differences in damage patterns from two different inspection years using images of the damage.
- Statistical comparison functions provide valuable information about the location and size of differences between two damage maps.
In preparing reports and documentation
The integrated report tool makes it easy to import and save image sections and damage tables in a reporting document.
A wide range of printing functions helps the user to prepare documentation of the condition of the structure. The photo on the left shows a book of images with a deformation analysis. The scale can be defined as needed. In this example, one zone of the structure is displayed per page.
The printout can include a range of content:
- Laser scanner intensity image
- TS4 colour image
- Thermal image
- Damage map
- Clearance analysis
- Deformation analysis
- Target/actual profile analysis